Cloud monitoring pricing is deliberately hard to compare. One vendor charges per host, another per gigabyte, a third per memory-hour — and the sticker price almost never matches the invoice. This guide puts verified July 2026 pricing for 15 tools side by side, explains the four pricing models, and shows where the hidden costs hide.
Snapshot notice: every figure below was verified against vendor pricing pages and current pricing analyses in July 2026. Monitoring vendors change rates often — treat this as a map, and confirm the exact number before you sign.
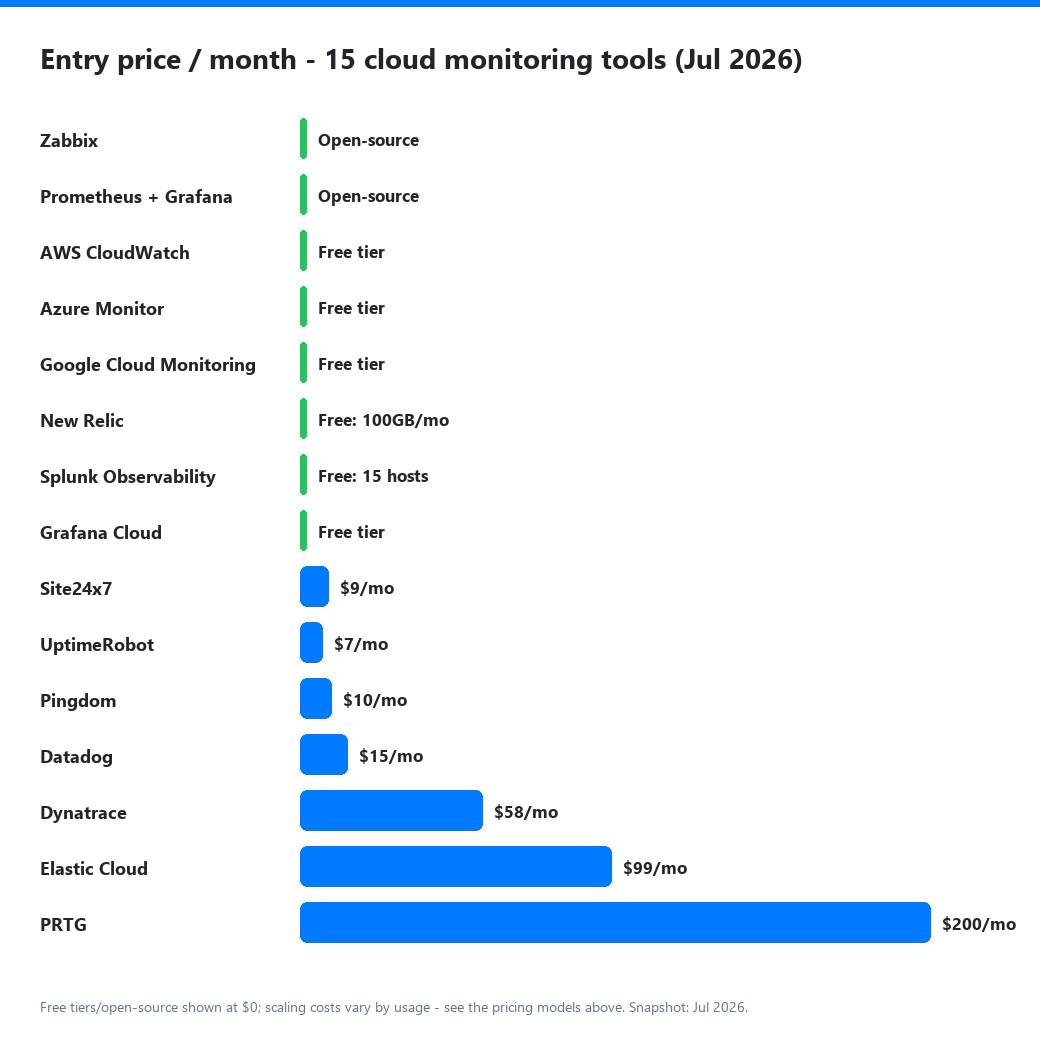
The big pricing table (July 2026)
| Tool | Model | Free tier | Entry price | What the real bill scales on |
|---|---|---|---|---|
| Datadog | Per host + per product | 14-day trial | $15/host/mo (infra, annual) | APM +$31/host, logs $0.10/GB in + indexing, custom metrics |
| New Relic | Per GB + per user | ✅ 100 GB/mo + 1 full user | $0.40/GB (Original), $0.60/GB (Data Plus) | Ingest volume + full-platform users (~$99/user) |
| Dynatrace | Consumption (DPS) | 15-day trial | ~$0.08/hr per 8 GiB host (≈$58/mo) | Host memory size, 15-min minimum billing blocks |
| Grafana Cloud | Usage-based | ✅ 10k series, 50 GB logs | $19/mo platform + $6.50/1k series | Active metric series, log GB, users ($8 each after 3) |
| Splunk Observability | Per host | ✅ up to 15 hosts | $15/host/mo (infra, annual) | App & Infra $60/host, End-to-End $75/host |
| Elastic Cloud | Resource-based | 14-day trial | $99/mo (Standard hosted) | Provisioned RAM/storage/zones; serverless $0.07–0.09/GB |
| AWS CloudWatch | Pay-as-you-go | ✅ 10 metrics, 5 GB logs | $0 base | Logs $0.50/GB in, custom metrics $0.30 each, alarms |
| Azure Monitor | Pay-as-you-go | ✅ 5 GB logs/mo | $0 base | Log Analytics ~$2.30/GB (Basic ~$0.50/GB) |
| Google Cloud Monitoring | Pay-as-you-go | ✅ free allotments | $0 base | Metrics $0.2580/MiB, logs $0.50/GiB; alerting fees from Sep 2026 |
| Site24x7 | Flat plans | 30-day trial | $9/mo (Starter, 10 monitors) | Plan tier (Pro $35, Classic $89, Elite $225) |
| PRTG | Per sensor | 30-day trial | ~$200/mo / $1,750/yr (500 sensors) | Sensor count (a device uses 5–30+ sensors) |
| UptimeRobot | Flat plans | ✅ 50 monitors (personal) | $7/mo (Solo) | Monitor count, check interval, SMS credits |
| Pingdom | Flat plans | ❌ trial only | $10/mo (synthetic) | Monitor count; RUM sold separately |
| Zabbix | Open source | ✅ everything | $0 (self-hosted) | Your servers + your time; paid support optional |
| Prometheus + Grafana | Open source | ✅ everything | $0 (self-hosted) | Your servers + your time; storage at scale |
The four pricing models — and who they favor
1. Per-host pricing (Datadog, Splunk Observability)
You pay a fixed rate for every monitored server or VM. Predictable if your fleet is stable, punishing if you run many small hosts or autoscaling groups. Datadog infrastructure starts at $15/host/month (annual) — but APM adds $31/host, and since APM requires a paired infrastructure license, real APM coverage costs ~$46/host/month. Splunk Observability runs $15 (infra) to $75 (end-to-end) per host and gives away its first 15 hosts free — one of the more generous free tiers for small fleets.
Favors: stable, medium-sized fleets of beefy hosts. Punishes: microservices on many small nodes.
2. Per-GB ingest pricing (New Relic, Elastic serverless, native cloud tools)
You pay for the telemetry you send. New Relic bundles everything into $0.40/GB beyond a 100 GB free monthly allowance (Data Plus with longer retention: $0.60/GB) plus per-user fees — full platform users run about $99/user/month beyond the first. The native cloud tools work the same way: CloudWatch logs at $0.50/GB, Google Cloud logging at $0.50/GiB, and Azure Log Analytics at a market-topping ~$2.30/GB on the default tier.
Favors: teams that control their data volume. Punishes: chatty applications and debug-level logging left on in production.
3. Consumption / hourly pricing (Dynatrace)
Dynatrace’s DPS model bills full-stack monitoring at $0.01 per memory-GiB-hour — about $58/month for an 8 GiB host, or ~$232/month for a 32 GiB host. Two traps: billing rounds up to 15-minute blocks (a 1-minute ephemeral container bills as 15 minutes), and memory rounds up with a 4 GiB minimum. For short-lived workloads the effective rate can be 2–4× the nominal one.
Favors: long-running hosts, enterprises that negotiate (25–50% discounts are typical above 500 hosts). Punishes: ephemeral and serverless-style workloads.
4. Flat plans (Site24x7, UptimeRobot, Pingdom, PRTG)
A fixed monthly fee for a bundle of monitors or sensors. Site24x7’s $9/month Starter (10 monitors, 500 MB logs) is the cheapest all-in-one entry in the market; PRTG bundles 500 sensors for ~$1,750/year. These are the easiest bills to predict — what you see is very close to what you pay.
Favors: SMBs and anyone who values a predictable invoice. Punishes: nobody, really — until you outgrow the bundle.
Where the hidden costs hide
The gap between sticker price and invoice comes from a handful of repeat offenders:
- Custom metrics. Datadog and CloudWatch both charge per custom metric ($0.30 each on CloudWatch’s first tier). A Kubernetes cluster emitting high-cardinality labels can generate thousands.
- Log indexing vs ingestion. Datadog charges separately for ingesting ($0.10/GB) and indexing logs — index everything and the log bill can dwarf the host bill.
- Span overages. Datadog APM includes 150 GB of spans per host; high-throughput services blow past it quietly.
- Per-user fees. New Relic (~$99/full user) and Grafana Cloud ($8/user after 3) charge for people, not just data.
- Retention. Longer retention is a paid dimension almost everywhere — Azure charges ~$0.10/GB/month after 31 days, Grafana Cloud $0.10/GB/month for logs.
- Alerting. Google Cloud Monitoring begins charging $0.35/month per metric reference in an alerting policy starting September 2026 — a new line item to watch.
Three realistic monthly budgets
Solo developer / side project — $0. Grafana Cloud free tier (10k series, 50 GB logs) or New Relic’s 100 GB free, plus UptimeRobot’s free uptime checks. You genuinely don’t need to pay.
Small startup, ~10 hosts — $50–300/month. Site24x7 Pro ($35) or Datadog infrastructure-only (~$150 for 10 hosts) plus a free uptime layer. Add APM selectively — instrumenting only your two critical services keeps Datadog APM at ~$92 instead of ~$460.
Mid-size SaaS, ~50 hosts + logs — $1,500–8,000/month. This is where model choice matters most: a 50-host Datadog estate with APM and 500 GB of logs lands around $3–5k; New Relic at ~1 TB ingest runs ~$400 in data plus user fees; Elastic Cloud production deployments typically land $1.5–8k. Negotiate — list price is the starting point, not the ending one.
How to pay less (without monitoring less)
- Exploit free tiers deliberately. New Relic’s 100 GB, Splunk’s 15 hosts and Grafana Cloud’s free plan are production-usable, not toys.
- Split uptime from observability. A $7/month uptime monitor covers availability alerting; save the expensive APM licenses for services that need deep tracing.
- Control log volume at the source. Sampling, dropping debug logs and routing verbose logs to cheap tiers (Azure Basic $0.50/GB, CloudWatch Infrequent Access $0.25/GB) routinely halves the bill.
- Match the pricing model to your architecture. Many small containers → avoid per-host pricing. Massive log volume → avoid per-GB pricing. Stable fleet → per-host is fine and predictable.
- Go open source where it’s cheap to run. Zabbix or Prometheus + Grafana cost engineering time instead of license fees — often the right trade for infrastructure metrics, with a managed tool layered on top only where it earns its keep.
Bottom line
There is no universally cheapest cloud monitoring tool — only the cheapest tool for your architecture. Flat-plan tools (Site24x7, UptimeRobot) win on predictability for SMBs; per-GB tools (New Relic) win for disciplined data diets; per-host tools (Datadog, Splunk) win for stable fleets; and open source wins whenever engineering time is cheaper than license fees.
For the full feature-by-feature comparison of every platform in our directory, see the directory homepage — and for adjacent picks, our guides to the best uptime monitoring tools and best status page tools.