Prometheus is the default answer to “how do we monitor this?” in the cloud-native world — and the most common source of confusion, because newcomers assume it competes with Grafana. It does not. Prometheus collects and stores your metrics and decides when to alert; Grafana draws the pictures. This guide covers how the pieces fit together, a working setup you can run in five minutes, the PromQL you actually need, and the two decisions that determine whether the stack stays cheap: cardinality and retention.
Prometheus vs Grafana: the division of labour
This is the single most useful thing to get straight before anything else.
| Prometheus | Grafana | |
|---|---|---|
| Job | Collect, store and query metrics; evaluate alert rules | Visualize data from many sources |
| Stores data? | Yes — its own time-series database | No — it queries other systems |
| Query language | PromQL (its own) | Whatever the data source speaks |
| Dashboards | Minimal expression browser only | Its entire purpose |
| Alerting | Rule evaluation → Alertmanager | Its own alerting engine, any data source |
| Replaces the other? | No | No |
You can run Prometheus without Grafana (you will hate the dashboards). You can run Grafana without Prometheus (pointing it at CloudWatch, Elasticsearch, a SQL database, or dozens of others). Together they are the most widely deployed open-source monitoring stack in existence, and both are free — see our round-up of the best open-source cloud monitoring tools for how they compare with Zabbix, Netdata and the rest.
How Prometheus works
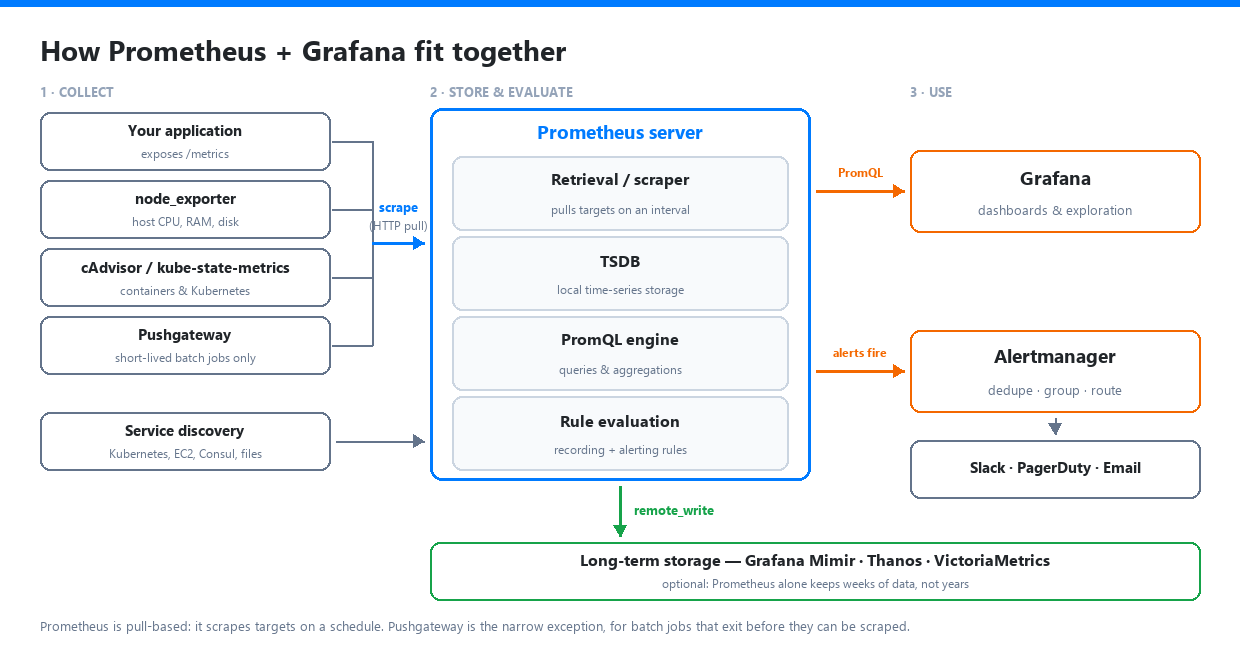
The whole system follows from one decision: Prometheus pulls. On a schedule you configure — usually every 15 to 60 seconds — it makes an HTTP request to a /metrics endpoint on each target and parses a plain-text response that looks like this:
# HELP http_requests_total Total HTTP requests.
# TYPE http_requests_total counter
http_requests_total{method="GET",status="200"} 48291
http_requests_total{method="GET",status="500"} 17
Every line is a time series: a metric name plus a set of key/value labels. That label set is what makes Prometheus powerful, and — as we will see — what makes it fall over if you abuse it.
The moving parts:
- Targets. Anything exposing
/metrics. Your own application (via a client library for Go, Python, Java, Node, Rust and others), or an exporter that translates something else into Prometheus format:node_exporterfor host metrics,cAdvisorandkube-state-metricsfor containers and Kubernetes,blackbox_exporterfor probing endpoints from outside, plus exporters for Postgres, MySQL, Redis, NGINX, and hundreds more. - Service discovery. In anything dynamic you do not list targets by hand. Prometheus discovers them from Kubernetes, EC2, Consul, DNS or files, and relabelling rules decide what to keep.
- The Prometheus server. Scrapes, stores to a local TSDB, answers PromQL queries, and evaluates recording and alerting rules on the same interval.
- Alertmanager. A separate process. Prometheus decides that an alert is firing; Alertmanager decides who hears about it — deduplicating, grouping, silencing and routing to Slack, PagerDuty, email or webhooks.
- Grafana. Queries Prometheus with PromQL and renders dashboards.
Because scraping is pull-based, Prometheus always knows whether a target answered. That is the built-in up metric, and it is the basis of the first alert almost everyone writes.
The Pushgateway exception. A batch job that runs for nine seconds every hour will never be scraped. For that case only, the job pushes its result to a Pushgateway that Prometheus scrapes instead. It is not a general-purpose push endpoint, and using it as one produces stale metrics that never disappear.
If the pull-versus-push trade-off matters to your architecture, we cover it in more depth in agent-based vs agentless monitoring.
The wider stack: Loki, Tempo, Mimir, Pyroscope
Grafana Labs built a family of backends that all follow Prometheus’s label-based model and all render in the same Grafana UI.
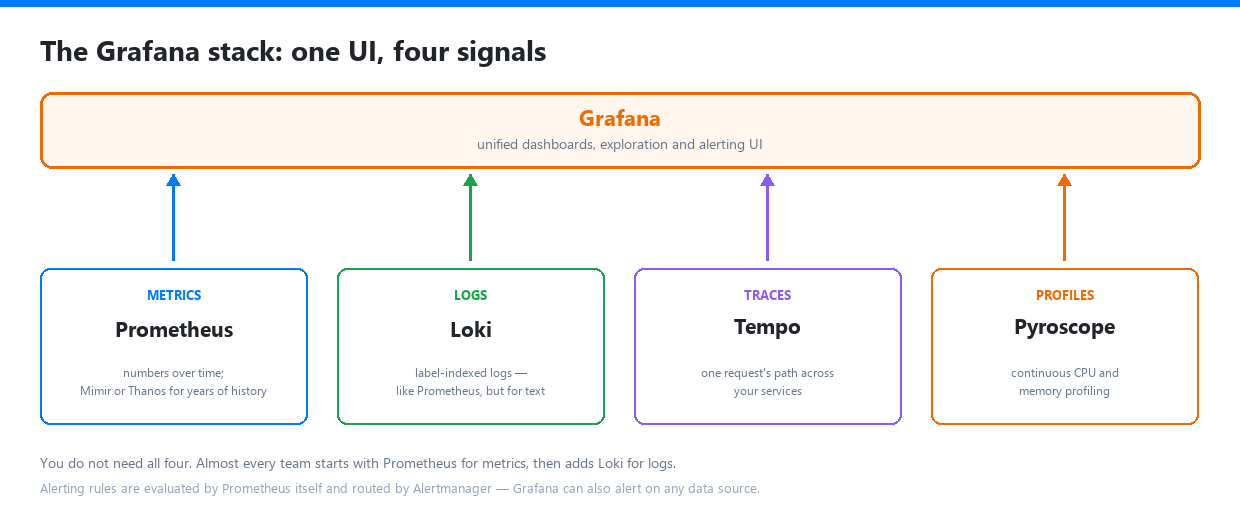
- Loki — logs, indexed by labels rather than full text. Cheap to run, and the same label selectors you know from PromQL.
- Tempo — distributed traces, so you can follow one request across services.
- Pyroscope — continuous profiling (which function is burning your CPU).
- Mimir — horizontally scalable long-term metric storage that speaks the Prometheus API. It succeeded Cortex, whose maintainers migrated to Mimir; Cortex is now effectively in maintenance mode.
You do not need all of these. Metrics first, logs second, and only add traces when you genuinely have a microservice latency problem to chase. That progression — and where the boundary sits between “monitoring” and “observability” — is the subject of cloud monitoring vs observability.
A working setup in five minutes
This is a complete, runnable stack: Prometheus, node_exporter for host metrics, and Grafana. Current stable releases as of July 2026 are Prometheus 3.13.1 and Grafana 13.1.
prometheus.yml
global:
  scrape_interval: 15s
  evaluation_interval: 15s

rule_files:
  - "rules/*.yml"

alerting:
  alertmanagers:
    - static_configs:
        - targets: ["alertmanager:9093"]

scrape_configs:
  - job_name: "prometheus"
    static_configs:
      - targets: ["localhost:9090"]

  - job_name: "node"
    static_configs:
      - targets: ["node-exporter:9100"]
docker-compose.yml
services:
  prometheus:
    image: prom/prometheus:v3.13.1
    ports: ["9090:9090"]
    volumes:
      - ./prometheus.yml:/etc/prometheus/prometheus.yml:ro
      - ./rules:/etc/prometheus/rules:ro
      - prometheus-data:/prometheus
    command:
      - "--config.file=/etc/prometheus/prometheus.yml"
      - "--storage.tsdb.retention.time=15d"

  node-exporter:
    image: prom/node-exporter:latest
    ports: ["9100:9100"]

  grafana:
    image: grafana/grafana:13.1.0
    ports: ["3000:3000"]
    environment:
      - GF_SECURITY_ADMIN_PASSWORD=changeme
    volumes:
      - grafana-data:/var/lib/grafana

volumes:
  prometheus-data:
  grafana-data:
Run docker compose up -d, then:
- Check the targets. Open
http://localhost:9090/targets. Both jobs should showUP. Ifnodeis down, it is nearly always a container-networking or firewall issue, not Prometheus. - Add the data source in Grafana.
http://localhost:3000→ Connections → Add data source → Prometheus → URLhttp://prometheus:9090(the service name, notlocalhost, because Grafana is calling from inside the Docker network). This is the single most common setup mistake. - Import a dashboard. Dashboards → New → Import → ID 1860 (“Node Exporter Full”). You now have a few hundred host metrics charted without writing a single panel.
Start from a community dashboard, then build your own. Hand-crafting panels before you know which metrics you care about wastes a lot of evenings.
PromQL: the queries you will actually use
PromQL looks alien for about a day. Five patterns cover most real work.
1. Is it alive?
up{job="node"}1 for reachable, 0 for not.
2. Turn a counter into a rate. Counters only ever increase, so the raw number is meaningless — you want per-second change:
rate(http_requests_total[5m])3. Aggregate away the labels you do not care about:
sum by (status) (rate(http_requests_total[5m]))4. Error ratio — the single most useful reliability query:
sum(rate(http_requests_total{status=~"5.."}[5m]))
  /
sum(rate(http_requests_total[5m]))
5. 95th-percentile latency from a histogram:
histogram_quantile(
  0.95,
  sum by (le) (rate(http_request_duration_seconds_bucket[5m]))
)
And the one host query everyone copies — CPU utilisation as a percentage:
100 - (avg by (instance) (rate(node_cpu_seconds_total{mode="idle"}[5m])) * 100)The mental model: select series with {}, transform with rate(), aggregate with sum by (). Note that rate() needs at least two samples in its window, so keep the range ([5m]) at four or more times your scrape interval.
Which metrics deserve a dashboard at all is a separate question — start with the four golden signals covered in cloud monitoring metrics that matter.
Alerting
Alert rules live in Prometheus, not Grafana. A rule file:
groups:
  - name: availability
    rules:
      - alert: InstanceDown
        expr: up == 0
        for: 5m
        labels:
          severity: critical
        annotations:
          summary: "{{ $labels.instance }} is down"
          description: "{{ $labels.job }} target {{ $labels.instance }} has been unreachable for 5 minutes."

      - alert: HighErrorRate
        expr: |
          sum(rate(http_requests_total{status=~"5.."}[5m]))
            / sum(rate(http_requests_total[5m])) > 0.05
        for: 10m
        labels:
          severity: warning
        annotations:
          summary: "5xx error rate above 5%"
The for: clause is what separates a useful alert from a pager that everyone mutes: the condition must hold continuously for that duration before the alert fires, which absorbs the transient blips that are not worth waking anyone for.
Prometheus then hands firing alerts to Alertmanager, which groups related alerts into one notification, suppresses duplicates, applies silences during maintenance, and routes by label — severity: critical to PagerDuty, everything else to Slack.
Two rules of thumb worth more than any tooling: alert on symptoms users feel (error rate, latency, availability) rather than causes (CPU at 90% is not an incident if nobody notices), and make every alert actionable. For the availability targets those alerts defend, see uptime vs availability vs reliability.
Self-hosted or Grafana Cloud?
Prometheus and Grafana OSS have no licence cost and no data caps. What they cost is time: capacity planning, upgrades, storage, high availability, and someone who understands the TSDB when it misbehaves at 2 a.m.
Grafana Cloud is the managed version. Pricing verified against Grafana’s pricing page in July 2026:
| Free | Pro | |
|---|---|---|
| Metrics | 10,000 active series | $6.50 per 1,000 active series |
| Logs / traces / profiles | 50 GB each per month | ~$0.45/GB (write + process), $0.10/GB to retain |
| Users | 3 active | $8 per active user (3 included) |
| Retention | 14 days, all signals | 13 months metrics · 30 days logs & traces |
| Platform fee | — | $19/month |
| Support | Community | 8×5 email |
Snapshot: July 2026. Volume discounts apply automatically as usage grows; Advanced/Enterprise plans are quoted individually.
The honest decision rule:
- Self-host when you have Kubernetes expertise on the team already, when data residency or air-gapping is a requirement, or when your series count is large enough that per-series pricing hurts. The marginal cost of another 100k series on your own hardware is close to zero.
- Use Grafana Cloud when your team is small enough that an engineer-week per quarter of monitoring maintenance is real money, or when you want logs and traces without operating three more distributed systems. The free tier is not a trial — it does not expire.
For how this compares with per-host and per-GB commercial pricing, see cloud monitoring pricing compared, and for the wider platform shortlist, the best cloud monitoring tools.
Scaling past one server
A single Prometheus goes a remarkably long way — millions of active series on a well-specified host. What it does not do is retain years of data or survive its own node dying. When you hit either limit:
remote_writestreams samples from Prometheus to a long-term backend while local queries keep working. This is the standard path, and Remote-Write 2.0 (shipped in Prometheus 3.0) added metadata, exemplars and native histogram support with a smaller payload.- Grafana Mimir — horizontally scalable, Prometheus-API-compatible, and what powers Grafana Cloud’s metrics backend. The default recommendation for new deployments.
- Thanos — a CNCF incubating project that adds global query, downsampling and object-storage retention, often bolted onto existing Prometheus servers via a sidecar.
- VictoriaMetrics — a lighter-weight alternative known for resource efficiency and simpler operations.
For high availability, the usual pattern is two identically configured Prometheus servers scraping the same targets, with Alertmanager clustered so duplicate alerts are deduplicated rather than double-paged.
Where teams go wrong
Label cardinality. This causes more Prometheus outages than everything else combined. Every unique label-value combination is a separate time series with its own memory overhead. A user_id label on a metric with 500,000 users does not create one series — it creates 500,000. Never put user IDs, session IDs, request IDs, email addresses, timestamps or raw URL paths in labels. Audit with:
topk(10, count by (__name__)({__name__=~".+"}))and drop offenders with metric_relabel_configs before they are ingested.
Scraping too fast. A 5-second interval across a large fleet quadruples storage and load versus 20 seconds, and almost never changes a decision. 15–60 seconds is right for nearly everything.
Expecting event logging. Prometheus stores numeric samples at intervals. It does not store individual events, request logs or anything you need to look up by ID. That is Loki’s job.
Treating it as a billing system. Scrapes can be missed and samples are not guaranteed exactly-once. Metrics are for operational decisions, not invoices.
Forgetting for:. Rules without a for: clause fire on a single bad scrape. That is how alert fatigue starts.
When Prometheus is the wrong tool
It is not the universal answer:
- You need logs or full-text search. Use Loki, or the Elastic stack.
- You want APM-style code-level tracing out of the box. Prometheus gives you numbers, not flame graphs of your request path. Add Tempo, or use a commercial APM.
- Nobody will own it. A monitoring stack with no maintainer degrades into dashboards nobody trusts. If that is your situation, a managed tool is genuinely the better engineering decision — the shortlists in best cloud monitoring tools for startups and how to choose a cloud monitoring platform are aimed exactly at that call.
- You only need to know whether the site is up. That is a much smaller problem — see best uptime monitoring tools. Prometheus can do it with
blackbox_exporter, but a hosted checker is five minutes of work instead of an afternoon.
Bottom line
Prometheus and Grafana became the default open-source monitoring stack because the model is simple and the ecosystem is enormous: scrape numbers on an interval, store them with labels, query them with PromQL, alert on the ones that matter, and draw the rest. The stack costs nothing to license and a real amount of time to operate well.
Start with the Docker Compose above and a community dashboard. Add alerting rules for symptoms your users would actually notice. Watch your cardinality from day one — it is far easier to keep labels clean than to clean them up later. And when local retention stops being enough, reach for remote_write and Mimir rather than trying to make one server do something it was never designed to do.
More guides across the whole monitoring landscape are indexed on our guides hub.